Label numbers with scientific notation (e.g. 1e05, 1.5e-02)
Source:R/label-scientific.R
label_scientific.RdLabel numbers with scientific notation (e.g. 1e05, 1.5e-02)
Usage
label_scientific(
  digits = 3,
  scale = 1,
  prefix = "",
  suffix = "",
  decimal.mark = NULL,
  trim = TRUE,
  ...
)
Arguments
- digits
Number of digits to show before exponent.
- scale
A scaling factor:
xwill be multiplied byscalebefore formatting. This is useful if the underlying data is very small or very large.- prefix, suffix
Symbols to display before and after value.
- decimal.mark
The character to be used to indicate the numeric decimal point. The default (
NULL) retrieves the setting from the number options.- trim
Logical, if
FALSE, values are right-justified to a common width (seebase::format()).- ...
Other arguments passed on to
base::format().
Value
All label_() functions return a "labelling" function, i.e. a function that
takes a vector x and returns a character vector of length(x) giving a
label for each input value.
Labelling functions are designed to be used with the labels argument of
ggplot2 scales. The examples demonstrate their use with x scales, but
they work similarly for all scales, including those that generate legends
rather than axes.
See also
Other labels for continuous scales:
label_bytes(),
label_currency(),
label_glue(),
label_number_auto(),
label_number_si(),
label_ordinal(),
label_parse(),
label_percent(),
label_pvalue()
Other labels for log scales:
label_bytes(),
label_log(),
label_number_si()
Examples
demo_continuous(c(1, 10))
#> scale_x_continuous()
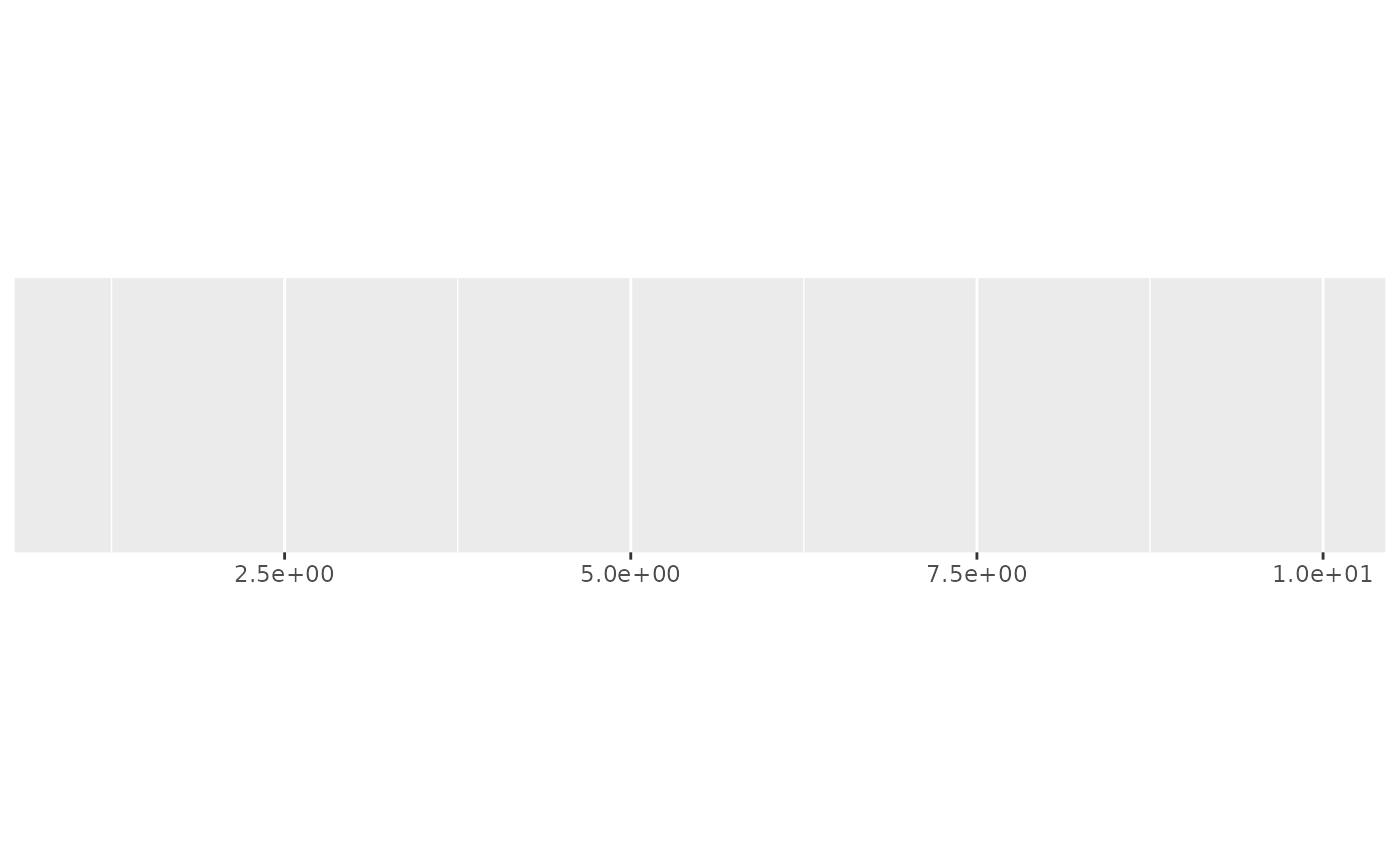
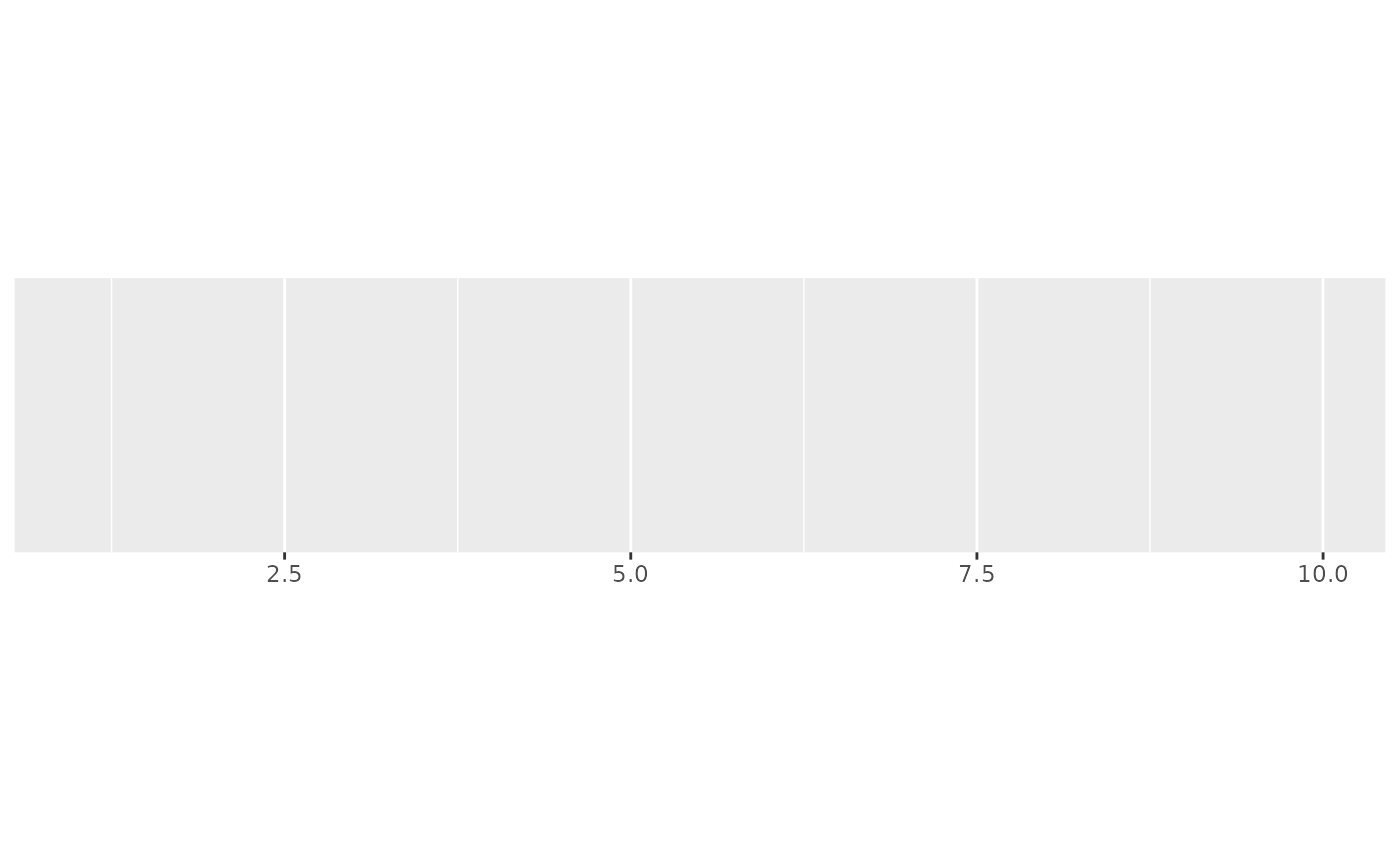 demo_continuous(c(1, 10), labels = label_scientific())
#> scale_x_continuous(labels = label_scientific())
demo_continuous(c(1, 10), labels = label_scientific())
#> scale_x_continuous(labels = label_scientific())
 demo_continuous(c(1, 10), labels = label_scientific(digits = 3))
#> scale_x_continuous(labels = label_scientific(digits = 3))
demo_continuous(c(1, 10), labels = label_scientific(digits = 3))
#> scale_x_continuous(labels = label_scientific(digits = 3))
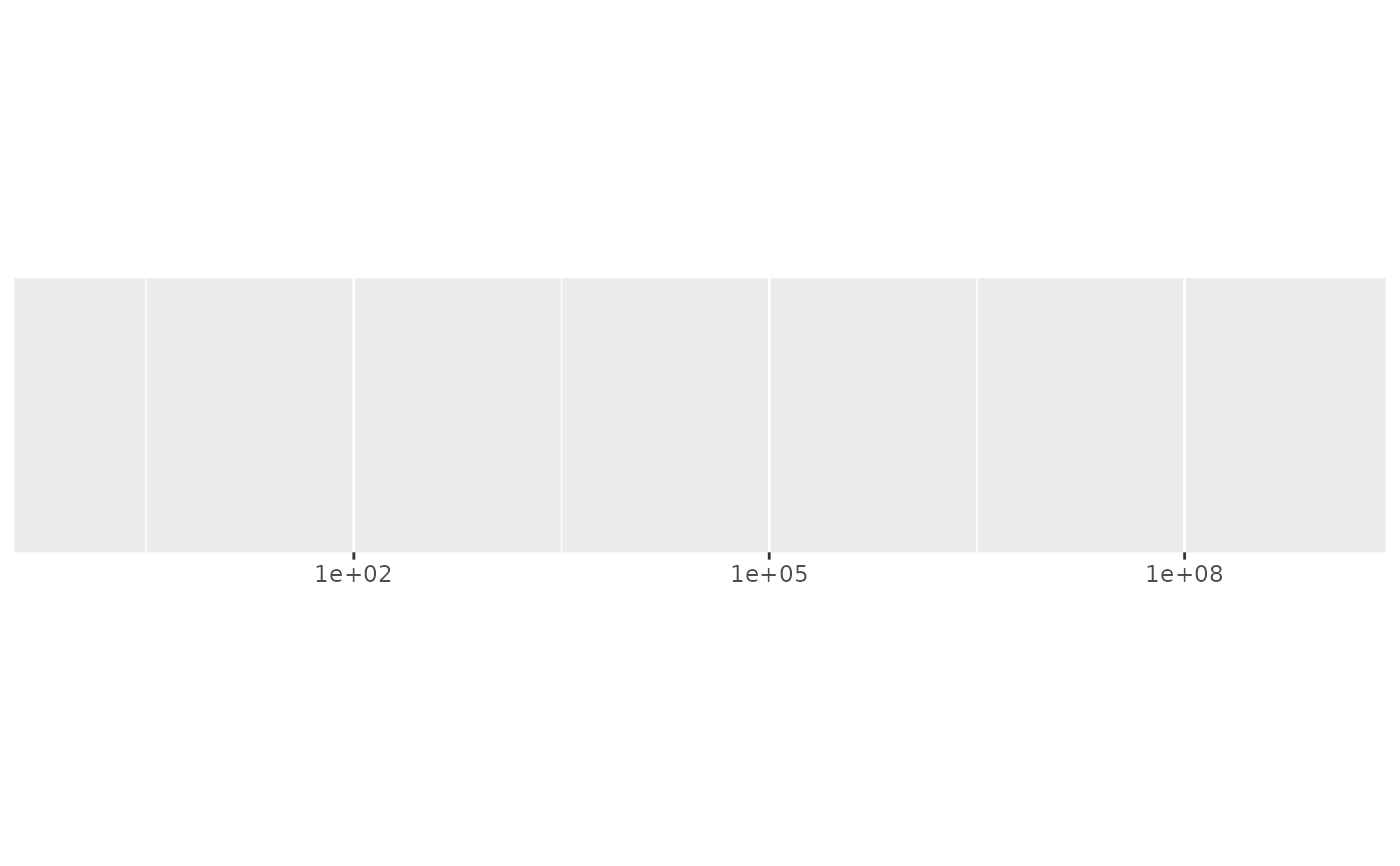
 demo_log10(c(1, 1e9))
#> scale_x_log10()
demo_log10(c(1, 1e9))
#> scale_x_log10()