Formatter for p-values, using "<" and ">" for p-values close to 0 and 1.
Arguments
- accuracy
A number to round to. Use (e.g.)
0.01to show 2 decimal places of precision. IfNULL, the default, uses a heuristic that should ensure breaks have the minimum number of digits needed to show the difference between adjacent values.Applied to rescaled data.
- decimal.mark
The character to be used to indicate the numeric decimal point. The default (
NULL) retrieves the setting from the number options.- prefix
A character vector of length 3 giving the prefixes to put in front of numbers. The default values are
c("p<", "p=", "p>")ifadd_pisTRUEandc("<", "", ">")ifFALSE.- add_p
Add "p=" before the value?
Value
All label_() functions return a "labelling" function, i.e. a function that
takes a vector x and returns a character vector of length(x) giving a
label for each input value.
Labelling functions are designed to be used with the labels argument of
ggplot2 scales. The examples demonstrate their use with x scales, but
they work similarly for all scales, including those that generate legends
rather than axes.
See also
Other labels for continuous scales:
label_bytes(),
label_currency(),
label_glue(),
label_number_auto(),
label_number_si(),
label_ordinal(),
label_parse(),
label_percent(),
label_scientific()
Examples
demo_continuous(c(0, 1))
#> scale_x_continuous()
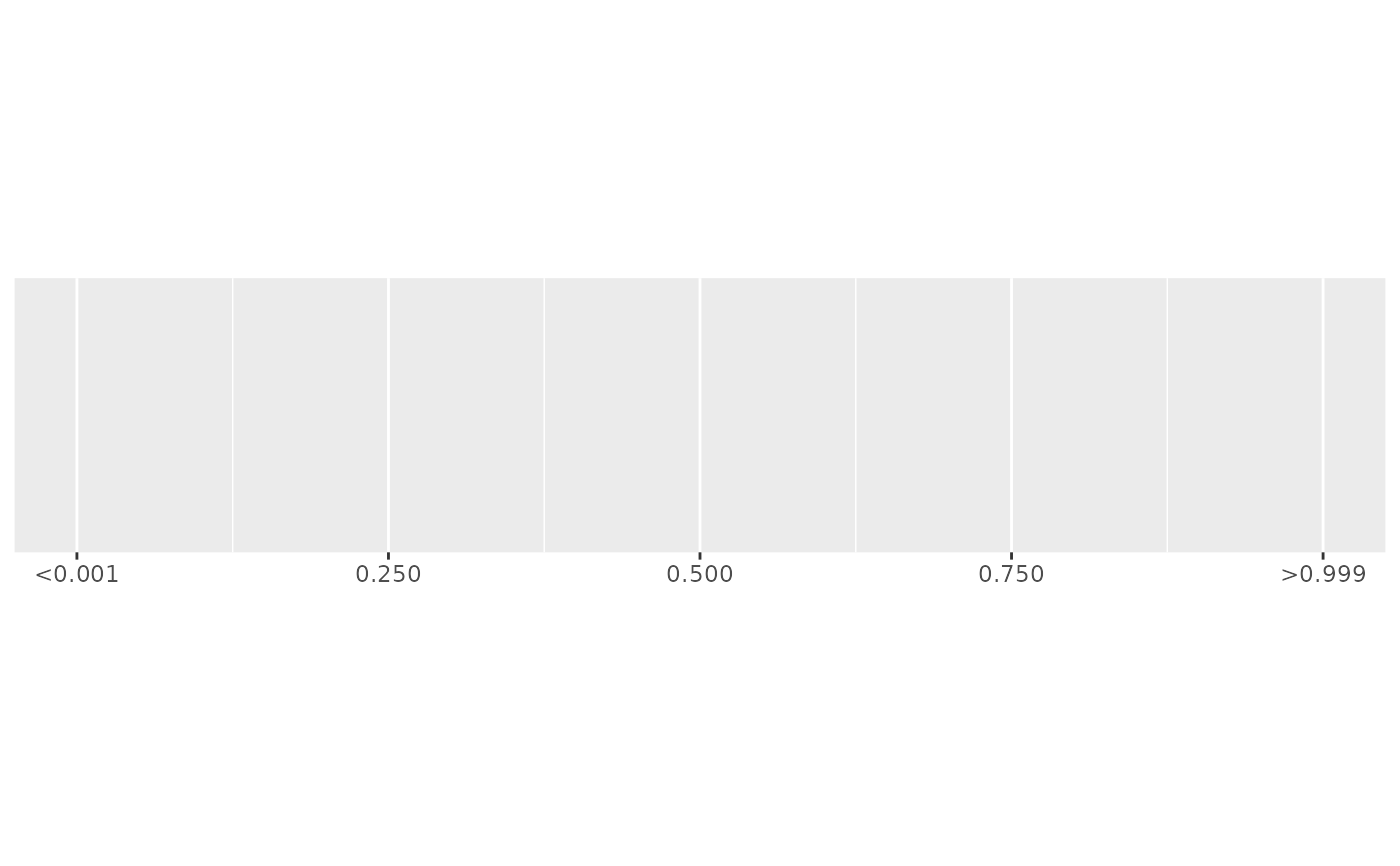
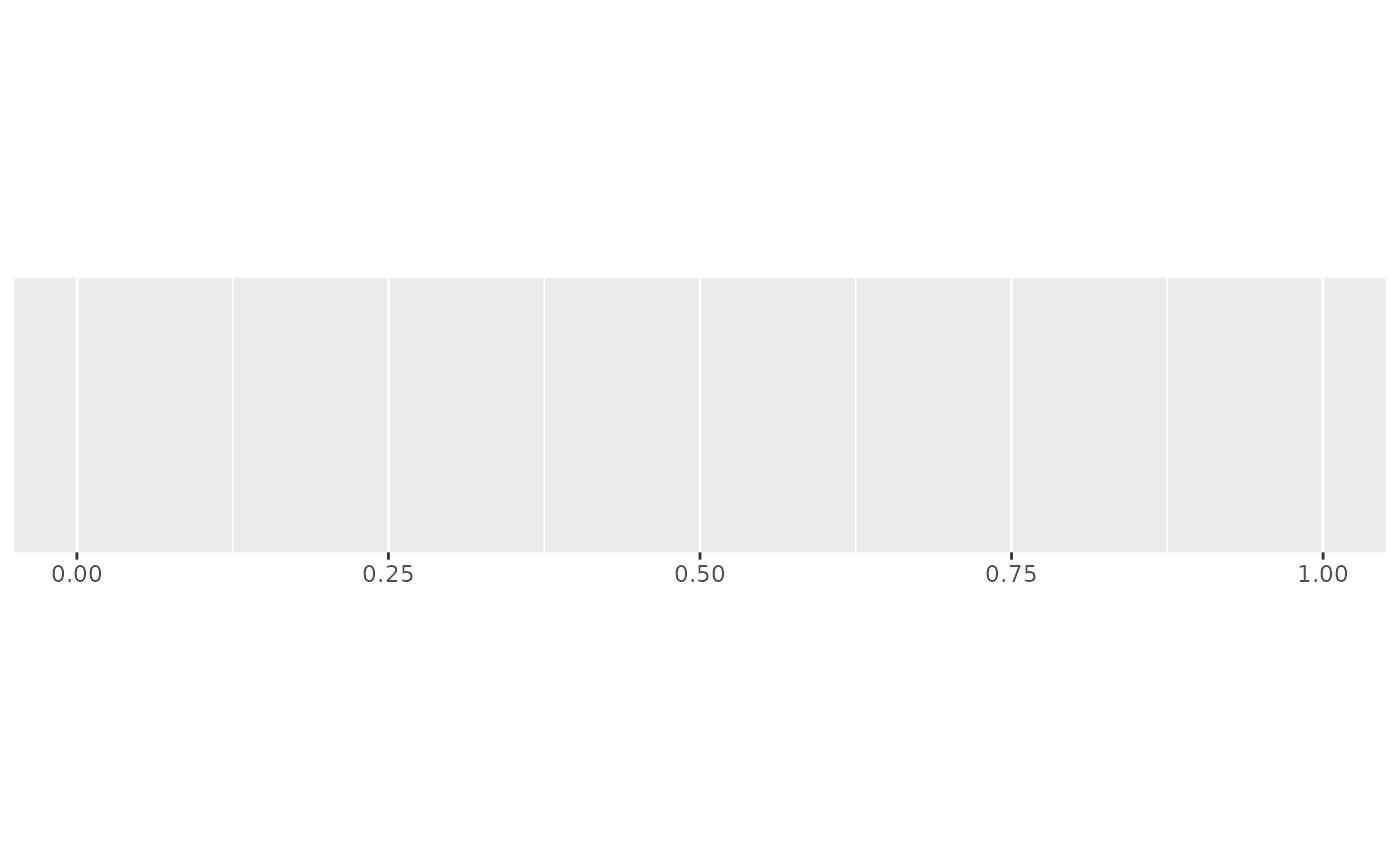 demo_continuous(c(0, 1), labels = label_pvalue())
#> scale_x_continuous(labels = label_pvalue())
demo_continuous(c(0, 1), labels = label_pvalue())
#> scale_x_continuous(labels = label_pvalue())
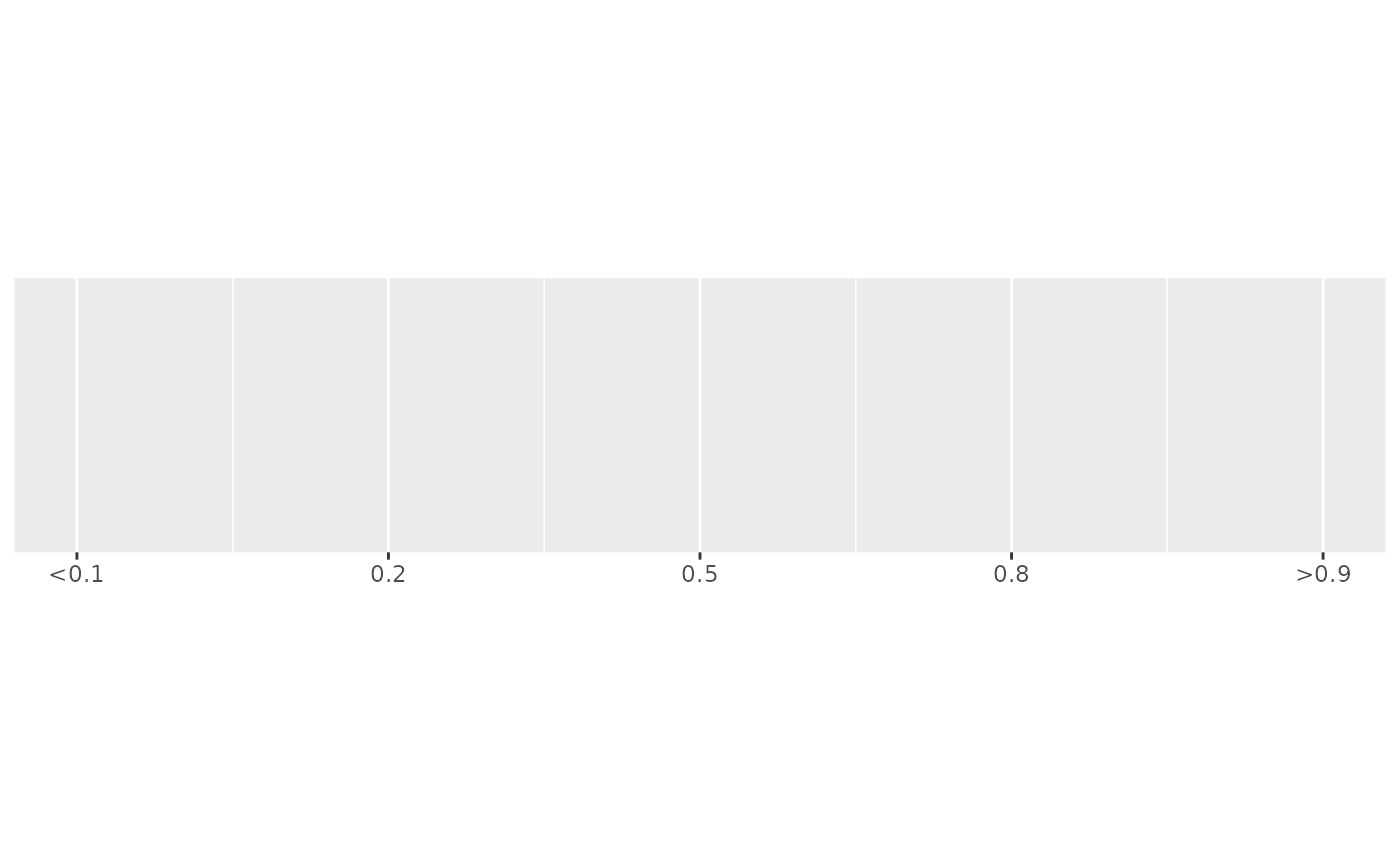
 demo_continuous(c(0, 1), labels = label_pvalue(accuracy = 0.1))
#> scale_x_continuous(labels = label_pvalue(accuracy = 0.1))
demo_continuous(c(0, 1), labels = label_pvalue(accuracy = 0.1))
#> scale_x_continuous(labels = label_pvalue(accuracy = 0.1))
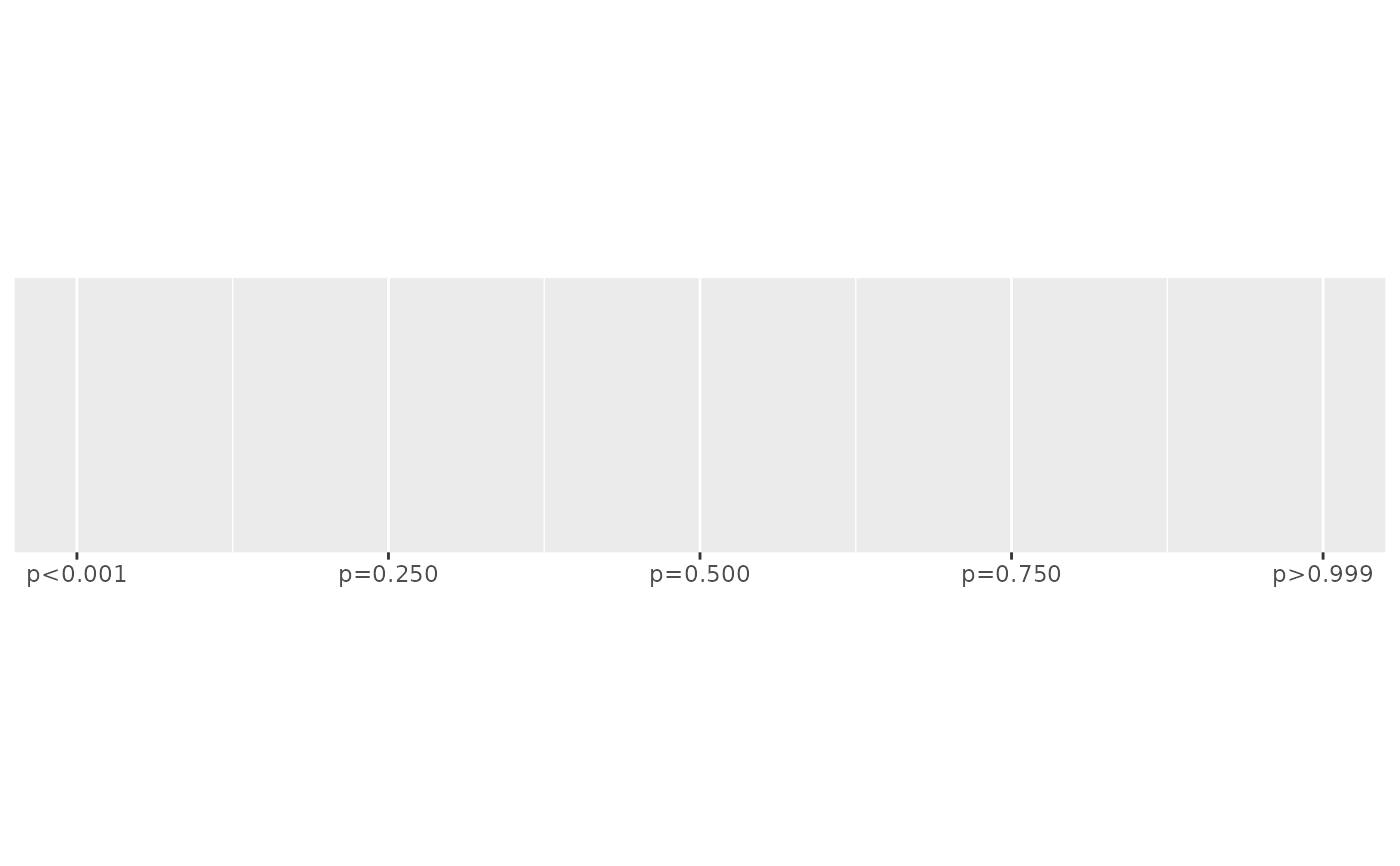
 demo_continuous(c(0, 1), labels = label_pvalue(add_p = TRUE))
#> scale_x_continuous(labels = label_pvalue(add_p = TRUE))
demo_continuous(c(0, 1), labels = label_pvalue(add_p = TRUE))
#> scale_x_continuous(labels = label_pvalue(add_p = TRUE))
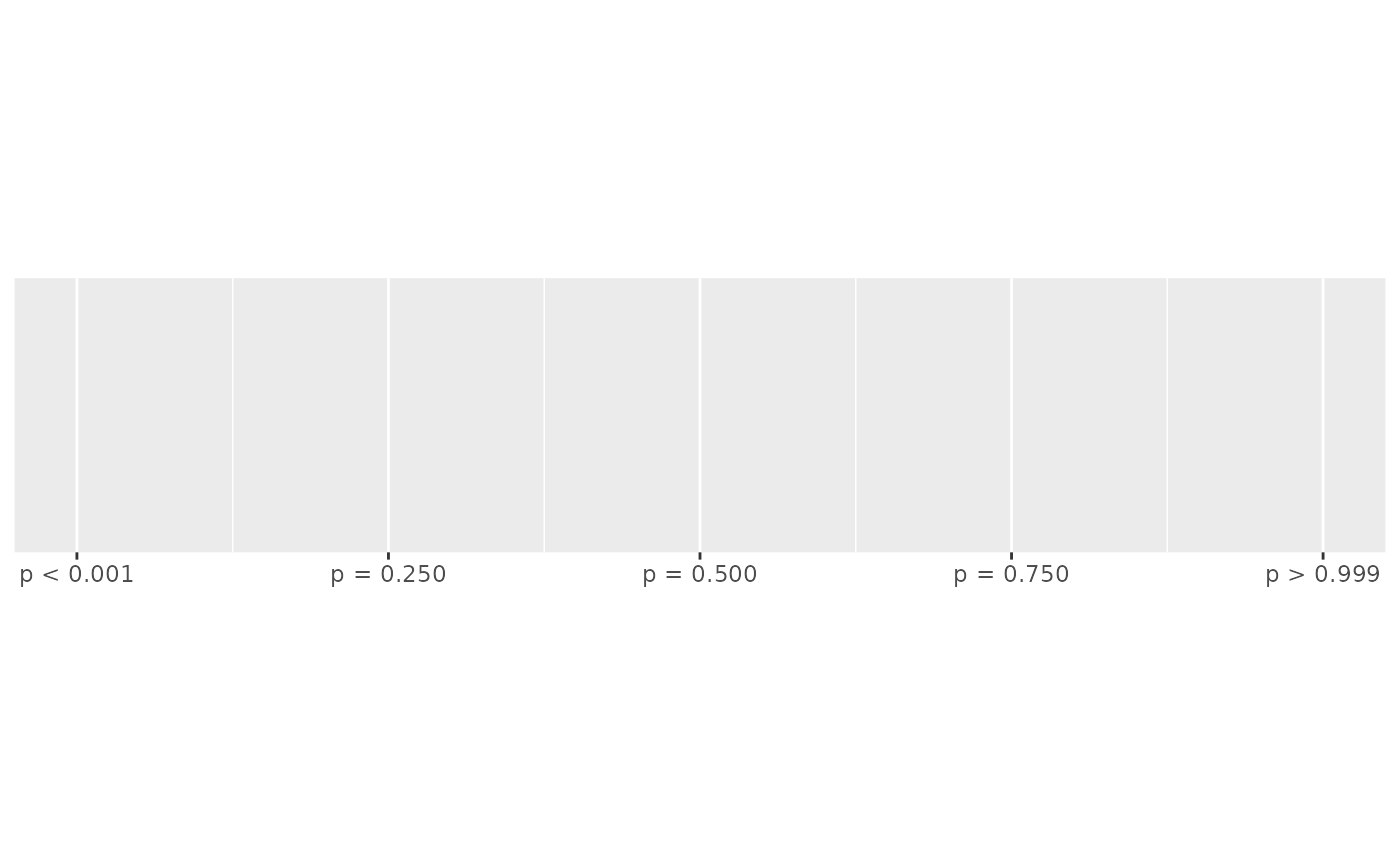
 # Or provide your own prefixes
prefix <- c("p < ", "p = ", "p > ")
demo_continuous(c(0, 1), labels = label_pvalue(prefix = prefix))
#> scale_x_continuous(labels = label_pvalue(prefix = prefix))
# Or provide your own prefixes
prefix <- c("p < ", "p = ", "p > ")
demo_continuous(c(0, 1), labels = label_pvalue(prefix = prefix))
#> scale_x_continuous(labels = label_pvalue(prefix = prefix))