label_log() and format_log() display numbers as base^exponent, using
superscript formatting. label_log() returns expressions suitable for
labelling in scales, whereas format_log() returns deparsed text.
Arguments
- base
Base of logarithm to use
- digits
Number of significant digits to show for the exponent. Argument is passed on to
base::format().- signed
Should a
+or-be displayed as a prefix? The default,NULL, displays signs if there are zeroes or negative numbers present.- x
A numeric vector to format
- ...
Passed on to
format().
Value
All label_() functions return a "labelling" function, i.e. a function that
takes a vector x and returns a character vector of length(x) giving a
label for each input value.
Labelling functions are designed to be used with the labels argument of
ggplot2 scales. The examples demonstrate their use with x scales, but
they work similarly for all scales, including those that generate legends
rather than axes.
See also
breaks_log() for the related breaks algorithm.
Other labels for log scales:
label_bytes(),
label_number_si(),
label_scientific()
Examples
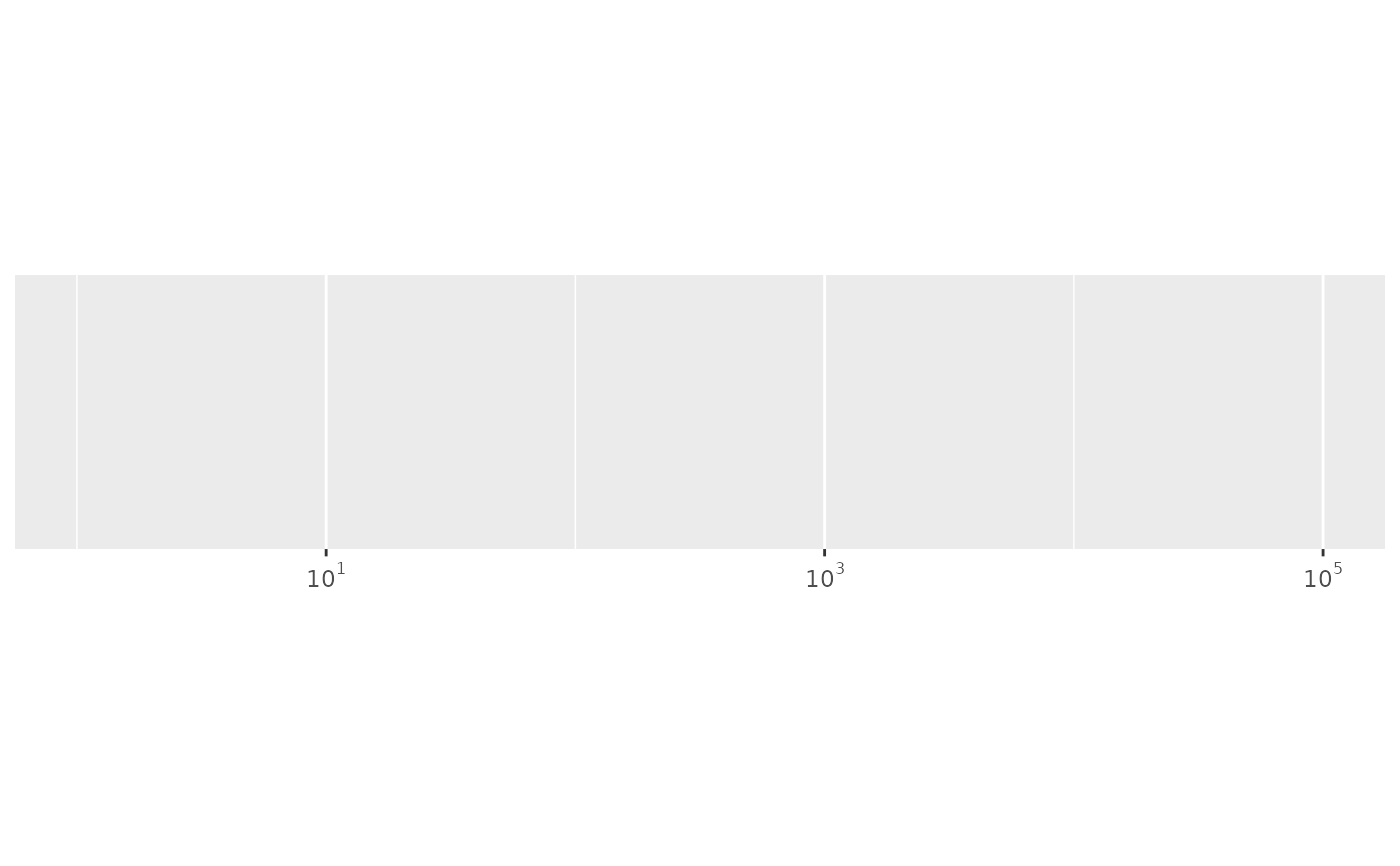
demo_log10(c(1, 1e5), labels = label_log())
#> scale_x_log10(labels = label_log())
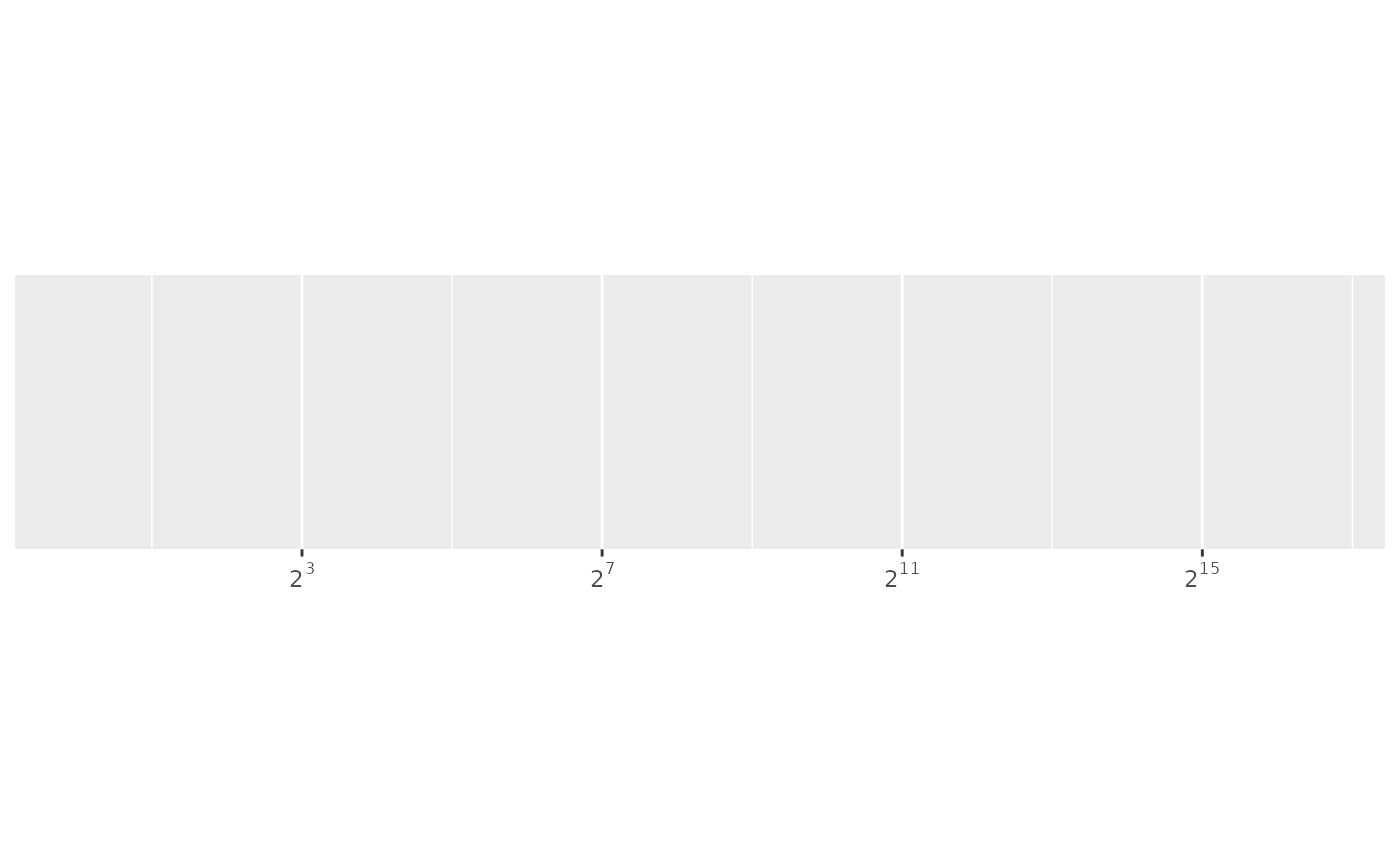
 demo_log10(c(1, 1e5), breaks = breaks_log(base = 2), labels = label_log(base = 2))
#> scale_x_log10(breaks = breaks_log(base = 2), labels = label_log(base = 2))
demo_log10(c(1, 1e5), breaks = breaks_log(base = 2), labels = label_log(base = 2))
#> scale_x_log10(breaks = breaks_log(base = 2), labels = label_log(base = 2))
 format_log(c(0.1, 1, 10))
#> [1] "10^-1" "10^ 0" "10^ 1"
format_log(c(0.1, 1, 10))
#> [1] "10^-1" "10^ 0" "10^ 1"